
Do you deliver value that is not captured in price? Do you provide services that are under-appreciated by your customers? If you answered “yes,” you have lots of good company. We constantly see organizations miss the potential to capture value because of misaligned price metrics, offering extra services above and beyond contract agreements, all you can eat offerings, and poor tracking of value delivered.
Let’s explore a simple tool to improve value capture within your organization that supports sales to conduct customer conversations and to ‘get price.’ This simple analysis will help uncover opportunities to increase revenue and profit through better value capture.
This simple value capture analysis is done as follows:
- For a specific product or service, identify 2-3 internal measures you feel best represent the value obtained by your clients (e.g. modules used, customer support time for your client)
- Create a bar graph with avg. realized prices on the y-axis and the value metric on the x-axis
- Analyze if the realized prices correlate with the value they get
It is important to choose metrics that correlate with value derived by your client and not just work done by your team. For example, if you have a customer support team who provides phone support to your clients that enables them to improve their sales capabilities, use the hours your team spent with customers as one of the internal measures. However, we should be careful to exclude the hours your team spent to resolve product technical issues – this time does not enhance client productivity. In a nutshell, the measure must track with the value accrued by your customer. It is not easy to identify measures that perfectly correlate with value delivered to a customer, but a proxy should be sufficient to understand it directionally.
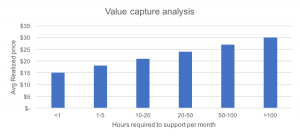
In the sample graph below, we plotted the number of hours required for customer issue and education support on the x-axis and the realized prices on the y-axis. Ideally, we would like the graph to look as is shown below; value captured grows from clients with greater consumption of the internal measure.
But, many times we observe relationships as shown in the graph below.
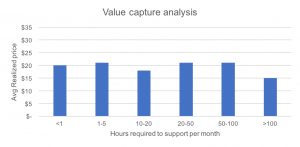
In this example, there is little difference in realized prices between clients despite wide variations in the value derived. This suggests that there is an opportunity to make one or more of the following changes to affect the P&L:
- Create a cap for support hours in service contracts and charge a premium if customers go above the limit
- Create a product offering with different service levels to naturally tier high value clients
- Change the price metric to charge by the hours of service
By creating such a simple analysis, you can:
- identify the need for a new offering structure
- uncover opportunities to improve the price metric
- uncover the potential to tweak the service contract to better capture the value created
By analyzing multiple measures in a similar manner for every product, you can understand the relationship between value captured and value delivered. This gives you the relevant information to take the first step towards a comprehensive change in your pricing model to drive improved value capture.