
Where is the market today as far as pricing analytics?
Some large companies are quite sophisticated in the use of analytics to support pricing, particularly consumer-facing companies in tech and consumer products. However, the bulk of the market, particularly in B2B and mid-sized companies, is just getting started. We see the need for detailed analysis that is agile and dynamic and leads to insights to the business.
 There are many challenges in getting pricing analytics right – first and foremost is getting clean, consistent data. Also critical is moving beyond simplistic segmentation and nice visuals – you need to get to get to insights that are actionable and then embed these insights in executive plans.
Analytics is the foundation for changing the pricing paradigm
Convincing others in an organization, particularly sales, that there is room to improve margins means that you must have data that is accurate and defensible.
You must understand what’s happening at the transaction level – what patterns, trends, and anomalies can be seen in the data. You will always find outliers, e.g. a low-value customer getting your best price. This is an opportunity for a Quick Win. These fairly obvious pricing uplift opportunities will help build “buy-in” in the organization.
After addressing the obvious holes in pricing, you can start tackling the larger issues of where organizations get stuck, which is the gradual evolution from reactive pricing to selling based on your impact to your customers in terms of revenue uplift or cost decrease. (Holden Advisors is a great resource for aligning different functional areas in a business around a better approach to pricing.) By developing pricing policies that are a mix of transaction-level insights and impact-driven selling tactics, you can start to shift the dialogue with customers. Having data to back you up gives you confidence in those customer conversations.
A Real World of Example of Data Analytics Supporting Pricing
Recently, Holden Advisors and AlignAlytics worked with a client that knew there were pricing opportunities, but the problem was identifying them despite disparate information systems and a huge amount of data (~30 million rows of data per month). This required cloud storage and sophisticated analytics tools. The result was the identification of customer/product/regional/behavioral cohorts (micro segments) where targeted price actions could be executed.
The analytics were embedded into the client’s decision-making process. The outcome was the implementation of six, outlier “price ups” resulting in $15 million in revenue uplift in the near-term with low levels of customer churn.
Lessons learned from this engagement:
- Don’t underestimate the challenge of cleaning and structuring data for analysis. That is a significant part of the task. Data is rarely clean.
- If data sizes are large, pick the right tools. Excel and BI tools like Tableau are OK for departmental analysis but are not up to the task for large data sets.
- Analytics have to support the business objective – avoid the trap of “analytics-for-analytics sake”. Many of the analytics that had been done previously by the client provided very little insight.
- If you can’t drill down to details real-time, the value of analytics is greatly diminished. A common challenge is answering executive questions on the spot. If you can’t show the underlying details when asked, the moment is lost, and confidence in the data is undermined.
Questions
As we reviewed this example in our recent webinar, a couple of questions were posed by attendees, which included:
“How do you apply analytics to defining value for a particular customer segment? Do you use R?”
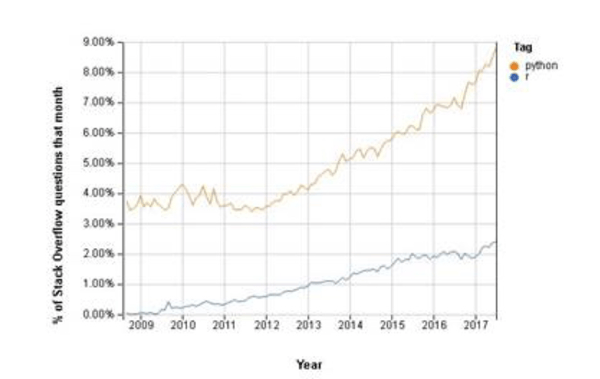
There’s a difference between the segmentation analytics and the subsequent analytics that might be used at a cohort level. In the front end, a tool like R was not necessary. R was created with statistics in mind and can be used to carry out predictive analytics, but it’s always the case that any data analytics project involves 90% cleaning and/or enriching the data (the segmentation) before you can get to the interesting analytics (cohort analysis) where more sophisticated tools can be applied. The AlignAlytics data science team uses python for analytics, and it can achieve an equivalent view as R. Something quite interesting is the following – a keyword search on stackoverflow.com (a website for Q&S on programming questions) shows the general trends for python vs. R.
How many different dimensions are used for segmentation?
It comes back to the data. If the data is robust and allows for analysis of customers based on size, geography, product bundles, response to promotions, term of the contract (1, 2 or 3 years), etc., then analysis can be done that includes all of those dimensions. We’re limited by the data available, but we can enrich it along various dimensions, e.g. by creating customer size/growth bandings, or dividing the customers and products into Pareto bandings. This would then extend to discussions around profitability analysis or complexity analysis – from the customer/product size bandings, we can then begin to define the 20% of customers driving 80% of profitability and the complexity in serving customers who are either low-volume or low-value.
Missed our Big Data Webinar last week, featuring Bill Bridgers (AlignAlytics) and Erin Cihak (Holden Advisors)? You can review the recording below: