
In my previous blog post, “Discounting Control Tool of Choice- The Price Plot” we discussed how a price plot, a very simple tool, can help an organization uncover very deep insights.
This week we are going to discuss how to develop pricing and revenue dashboards. These are again comparatively easy to develop, and will have a profound impact on decision-making in your company.
We recommend two dashboards to build out your standard set of reporting metrics:
1) A “bird’s eye view”- which is a top level organizational view of revenue results
2) A “worm’s eye view” which is a customer level view in an individual vertical
In the “bird’s eye view”, you can get a ten thousand-foot view of the pricing practices and behaviors in your company, the profit that is left on the table as a result of a discounting culture, and, whether you are moving in the right direction.
A sample “bird’s eye view” dashboard is shown below:
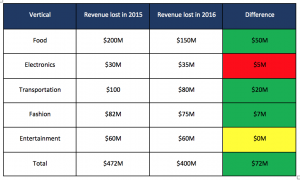
In the dashboard above, the first column represents the vertical/division in the organization. The second and third column represents the lost revenue due to discounting in 2015 and 2016. The final column is the difference between these two years. The difference can be negative if either the discount had increased or if the volume had increased or both.
The same dashboard can be done by year or quarter or month, whichever would best suit your organization. On a high level, this dashboard will help you understand the overall discounting direction of the company and the impacts of discounting from each division/vertical.
Now moving to the second dashboard, the “worm’s eye view”, which can uncover ‘why’ the division/vertical is performing the way it is performing.
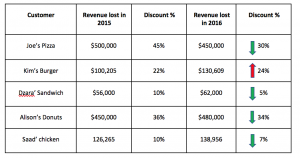
In the “worm’s eye view”, we pick up the top 5 - 10 customers with the highest potential to increase our client's revenue by reducing discounting and increasing pricing control. Remember the Pareto principle is usually true of discounting habits too; 20% of your customers will have the potential to reduce 80% of the discounting problem.
A sample of a “worm’s eye view” dashboard is shown below:
These two dashboards in combination will reveal a wealth of useful information and drive your team into action. The main insights:
- Understanding the profit left on table from discounting and driving the organization to validate & align on the rationale for the discounting, such as future revenue opportunities, increased partnership potential, or ability to sell important products into the market to market leaders
- Identifying the top customers who create the maximum impact profit by reducing discounting, addressing the discounting culture by account, and addressing the trending discounting habits of the organization
- Identifying the progress of pricing initiatives by division/vertical to reward positive change in behavior and to address areas that still need support to change.
Next week, we will discuss Waterfall analysis, Pareto analysis and discuss how both will complete your basic pricing reporting package. I’d also like to hear about your go-to analyses!