
In the previous three articles in the series What Gets Measured Gets Done, we discussed some basic reporting that every pricing and/or sales operations team should use to drive improved profits for the business. In this last article of the series, we are going to talk about uncovering the drivers of discounting and the effectiveness of an organization's profit improvement initiatives using a combination of waterfall analysis and Pareto analysis.
Once we understand the overall trend of the company using the price plot (Discounting Control Tool of Choice – The Price Plot), and the high-level pricing and revenue trends using the dashboards (Pricing and Revenue Dashboards: Keys to Profit Improvement), the next step is understanding at a high level where discounting is occurring and compare it to best practices. Waterfall analysis and Pareto analysis are great tools to uncover why and where discounting is occurring and where to focus an organization’s limited resources.
We will be using the familiar tool – waterfall analysis, but in a different tact to understand how discounting has changed in a year and what were the contributors to the net change. An example of a waterfall analysis is shown below. The X axis is the customer category and the Y axis is the revenue lost.
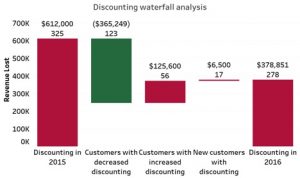
The graph depicts revenue lost due to discounting went from $612K to $378K (which is a good thing!). In this case, revenue improved by $365K due toimproved discounting controls in 123 customers. Unfortunately, at the same time, discounting increased with 56 customers leading to an increase in revenue lost $126K for that customer set. Also, we see that with new customers discounting is leading to a revenue loss of $7K. The waterfall analysis shows how effective our discounting controls have been, whether they had an impact a specific set of customers or in a channel, and how our discounting habits may continue in some areas of the business – like the acquisition of a new customer in this example.
Next, to understand which customers contribute to revenue lost due to discounting, we do a Pareto analysis. A Pareto analysis for the customers whose discounting has increased is shown below
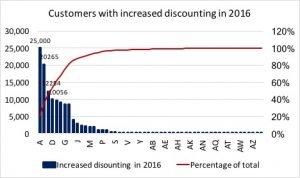
The above analysis shows that the top 10 customers (20%) from customer A to customer H, contributed to 80% of the increase in discounting. The Pareto principle, which states that 20% of your customers cause 80% of revenue lost, is the truth in most of the cases. This means we can focus our attention on a limited set of customers to investigate root cause and make specific account plans with sales to address the discounting.
The combination of waterfall analysis and Pareto analysis can uncover a wealth of information. Major insights include:
- Understanding the change in the discounting trend
- Uncovering best practices inside the sales organization to share with others in the team (By performing Pareto analysis on customers whose discounting decreased)
- Measuring pricing and profit improvement initiatives
- Highlighting the top customers where focus in required to improve account profitability
Clearly there are many, many other tools available to analyze pricing and profitability. It can be overwhelming. Start small and simple. Get your arms around the highlevel of discounting controls, and over time, add more analytics to gain more and more insights. The key is to get started in measuring. What gets measured, gets done.